Debugging with Nitric
Since Nitric applications are built with your choice of language you can use the tools and techniques you prefer to debug your applications. To get started, this guide will show you how to use Nitric's local development dashboard along with VS Code's debugger to quickly test an application on your own machine.
Here's a quick video demo of how to use Nitric's local dashboard for debugging with VS Code:
The local dashboard continues to get frequent feature updates, so might look different to the video depending on the version of the Nitric CLI you are using.
VS Code Debugging with Nitric Templates
Nitric's JavaScript and TypeScript templates include launch.json files which enable debugging in VS Code. A new project built from one of these templates will contain a directory structure that resembles the following:
project-root/├── .vscode/│ └── launch.json├── nitric.yaml├── ...
Before running the debugger, it's necessary to install the project's dependencies. In the case of TypeScript or JavaScript, you can do this by running:
npm install
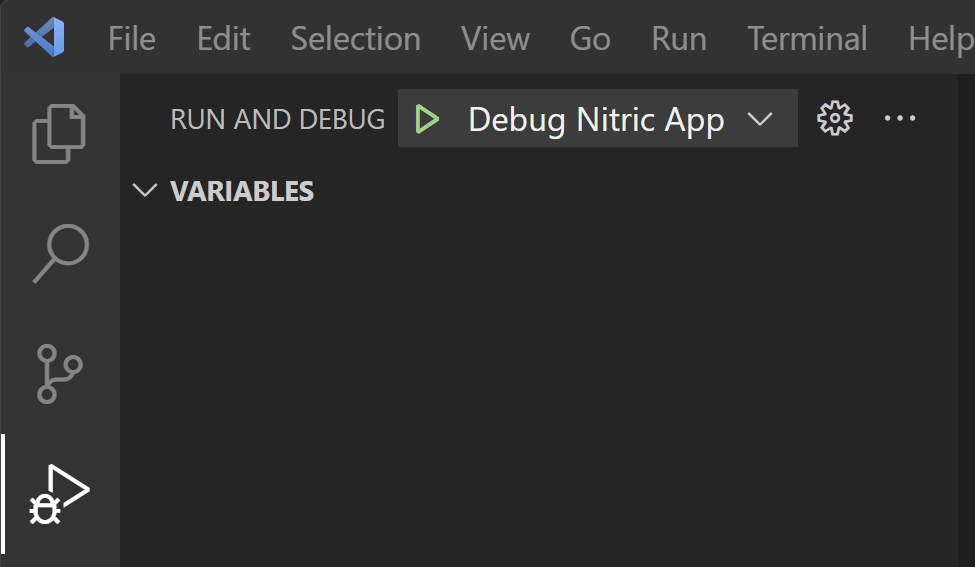
Next, in VS Code go to the Run and Debug tab and click start debugging (the green arrow) for Debug Nitric App:
To learn more about debugging with VS Code, you can explore additional resources and documentation.
From here you can use the Local Dashboard to send API requests or trigger other events in your application, catching errors and breakpoints in the debugger like any other application.
Next Steps
Take a look at our other guides for some inspiration on what to build next!