Local Debugging with Python
Debugging serverless-style applications can be challenging due to the way functions are triggered by events.
This guide will walk you through setting up local debugging for Nitric applications written in Python, using VSCode. We will use debugpy to connect a debugger to the service while it runs.
1. Add debugpy to our project
uv add debugpy
2. Modify the Python entry point
Add the following lines to the top of the service file (e.g., services/api.py). This starts a debug server that the IDE can attach to.
This code is for local development only and must not be included in production deployments.
import debugpyhost, port = debugpy.listen(("0.0.0.0", 52509)) # Static port for consistent debuggingprint(f"✅ Debugpy is listening on {host}:{port}", flush=True)
A static port (52509) is used so the IDE knows which port to connect to.
Update the launch.json configuration to match this port before starting the
debugger.
3. Update start command
Modify the start command to include an auto-reloader and ensure Python does not use frozen modules, which can interfere with debugpy:
name: my-projectservices:- basedir: ''match: services/*.pyruntime: pythonstart: uv run -- watchmedo auto-restart -p "*.py" --no-restart-on-command-exit -R -- python -Xfrozen_modules=off $SERVICE_PATHbatch-services: []websites: []runtimes:python:dockerfile: ./python.dockerfilecontext: ''args: {}
This configuration restarts the service on file changes and includes the necessary flags for debugging compatibility.
4. Configure VS Code
VS Code uses a .vscode/launch.json file to define how it should start or attach to a debugging session. In this case, the debugger doesn't launch the application itself—it attaches to the running service that was started manually from the terminal.
To create or update the launch.json file:
- Open the Run and Debug panel in VS Code (Ctrl+Shift+D or from the sidebar).
- Click "create a launch.json file" if one doesn't already exist.
- Choose "Python" when prompted for the environment.
- Replace the default configuration with the following:
{"version": "0.2.0","configurations": [{"name": "Python Debugger: Remote Attach","type": "debugpy","request": "attach","connect": {"host": "localhost","port": 52509},"pathMappings": [{"localRoot": "${workspaceFolder}","remoteRoot": "."}]}]}
Ensure the port matches the value used in the debugpy.listen() call. If
the port changes in the code, update it here as well.
5. Running the debugger
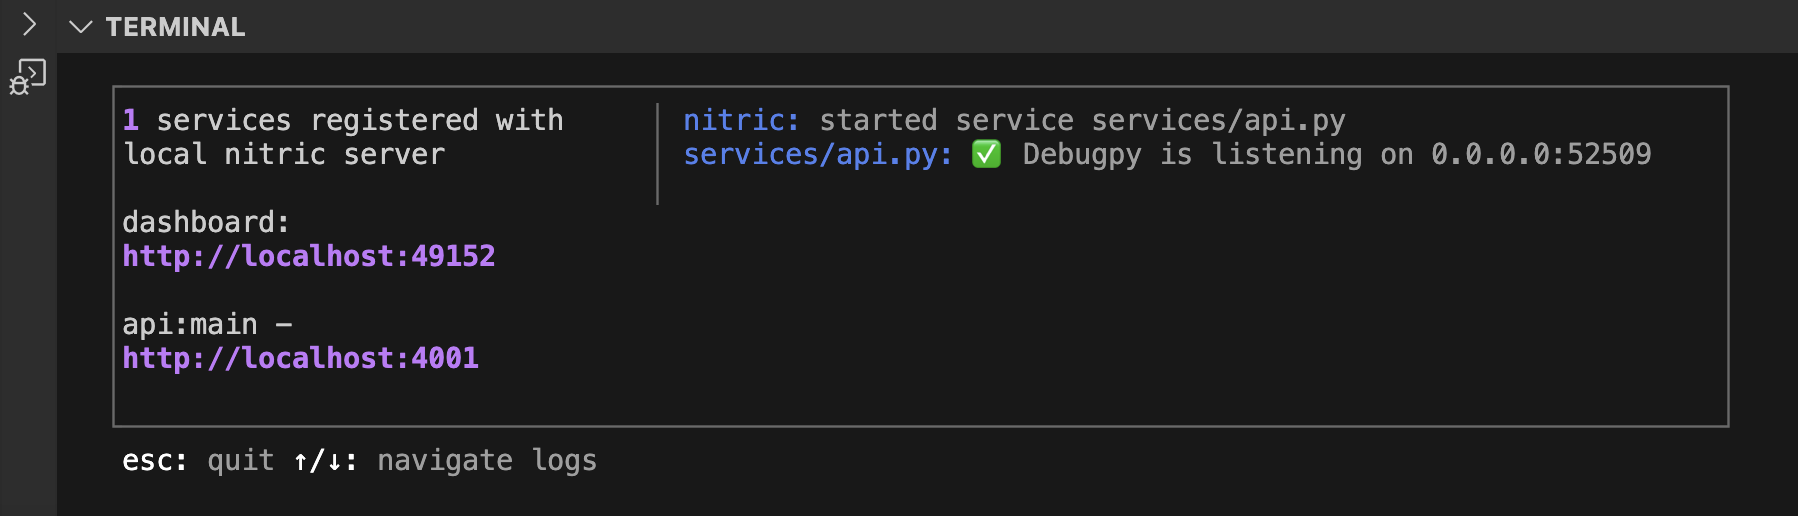
Start your nitric service with nitric start, in the Terminal, both the Nitric runtime output and the debugpy listener output will be visible, including the active debug port.
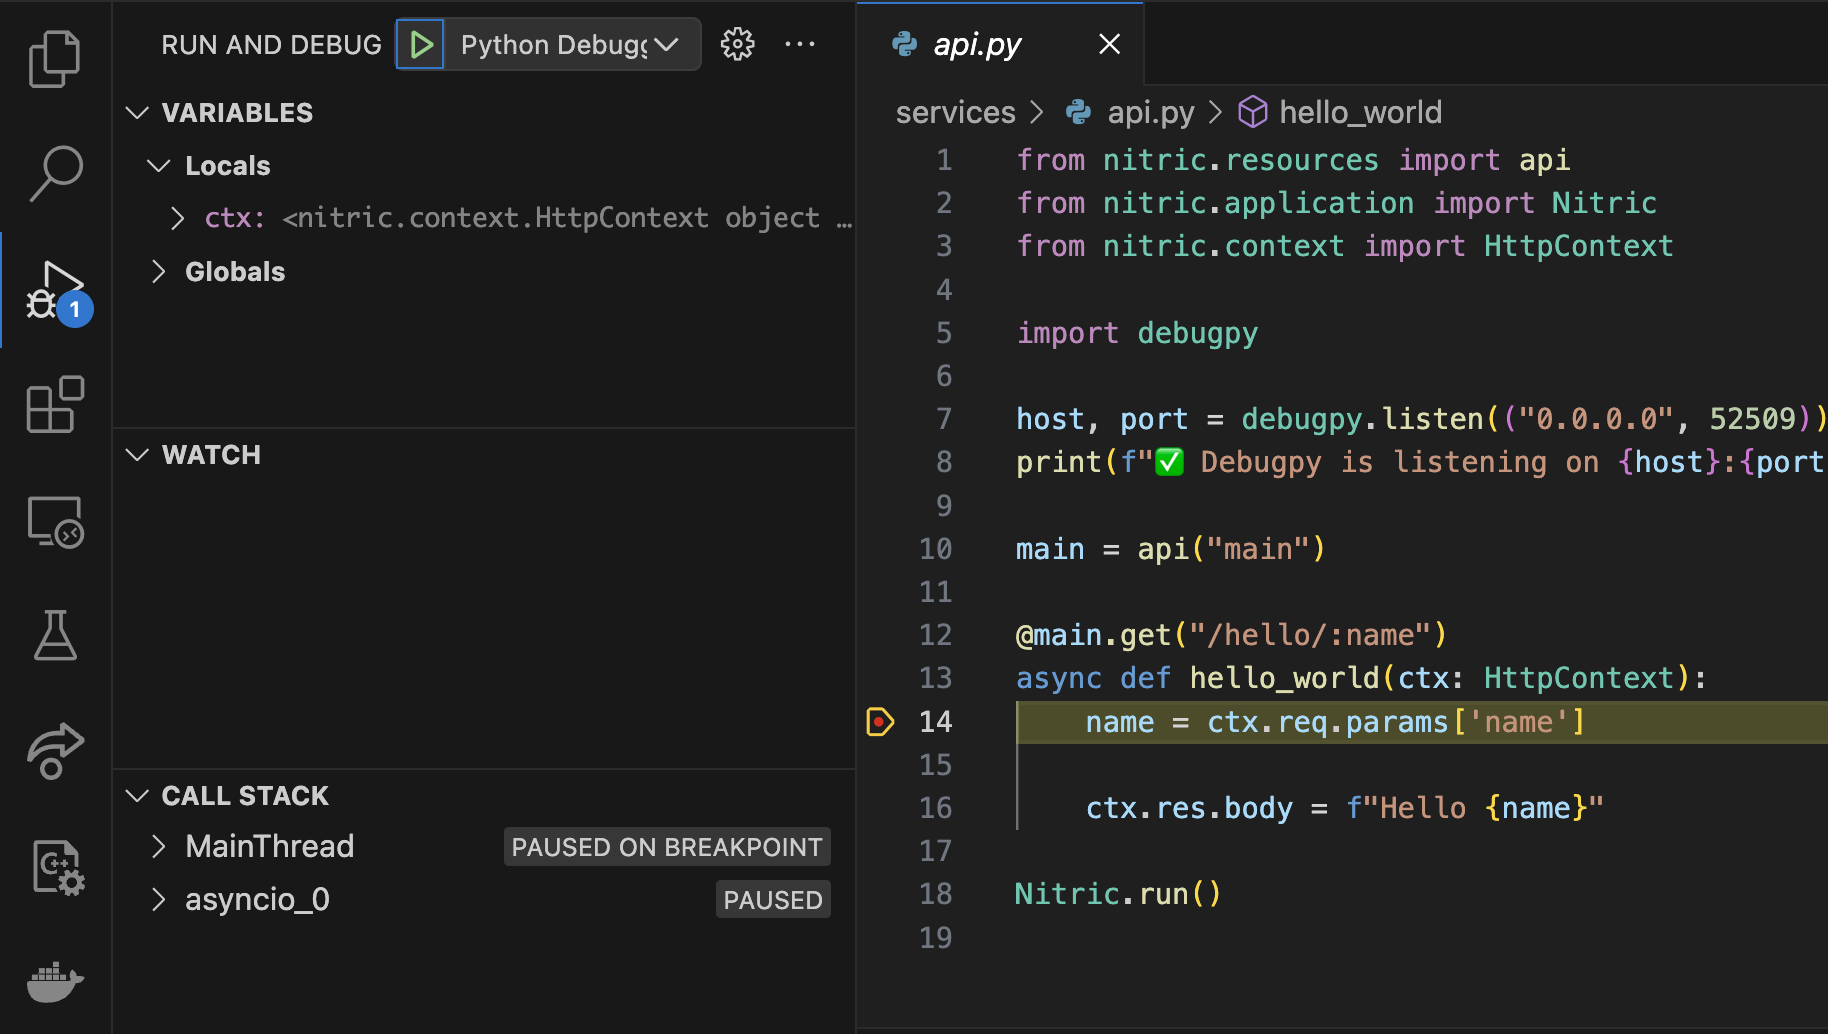
Now run the debugger and add breakpoints or watch variables.
6. Handling multiple services
Nitric applications typically have more than one service, however, debugpy only supports listening on a single (host, port) pair per service.
Your services will each have the following snippet with a unique port which will configure in our launch.json.
import debugpyhost, port = debugpy.listen(("0.0.0.0", 52509))print(f"✅ Debugpy is listening on {host}:{port}", flush=True)
You can update your vscode configuration to use compounds, for example if you had two services:
{"version": "0.2.0","compounds": [{"name": "Attach to Both Services","configurations": ["Python Debugger: Service 1","Python Debugger: Service 2"]}],"configurations": [{"name": "Python Debugger: Service 1","type": "debugpy","request": "attach","connect": {"host": "localhost","port": 52509},"pathMappings": [{"localRoot": "${workspaceFolder}","remoteRoot": "."}]},{"name": "Python Debugger: Service 2","type": "debugpy","request": "attach","connect": {"host": "localhost","port": 52510},"pathMappings": [{"localRoot": "${workspaceFolder}","remoteRoot": "."}]}]}
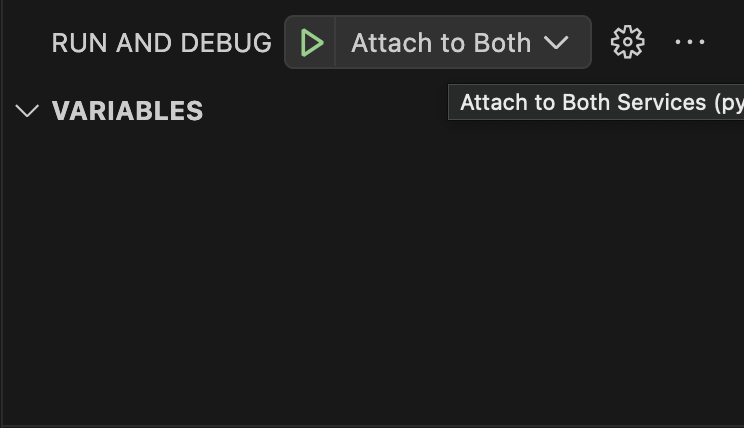
Now in Run and Debug you can select Attach to both:
Have feedback on this page?
Open GitHub Issue