Building a data visualization API with Nitric
What we'll be doing
We'll be making a serverless application which can take information from a HTTP request and generate a histogram. This is a basic implementation which is completely open for extension. Optional extensions include being able to add a legend to the plot, or allowing new types of graphs such as a scatter plot or pie chart.
Prerequisites
- uv - for Python dependency management
- The Nitric CLI
- (optional) Your choice of an AWS, GCP or Azure account
Getting started
We'll start by creating a new project for our API.
nitric new histogram-api py-starter
Next, open the project in your editor of choice.
cd histogram-api
Make sure all dependencies are resolved using uv:
uv sync
Starting from scratch in the api.py service file, lets start by importing and defining our api.
from nitric.resources import apifrom nitric.application import Nitricfrom nitric.context import HttpContextmain_api = api("main")Nitric.run()
We can then define our api route which will accept the histogram data to then be returned as an image.
from nitric.resources import apifrom nitric.application import Nitricfrom nitric.context import HttpContextimport matplotlib as pltmain_api = api("main")@main_api.get("/histogram")async def create_histogram(ctx: HttpContext) -> None:passNitric.run()
The route will be registered for a GET method so that it is a link that can be embed. For example, once the API is complete, it will be able to be used in image sources like:
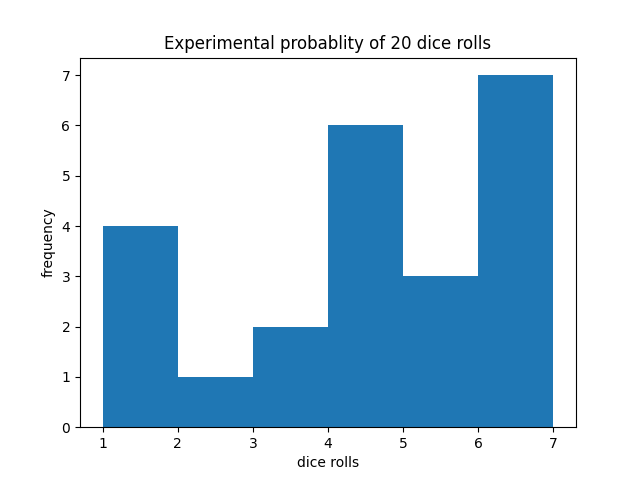
<imgsrc="http://localhost:4001/histogram?data=1,1,2,2,2,3,3,3,3,5,6,4,5,3,2,6,6,6,5,4&ylabel=frequency&xlabel=dice rolls&title=Experimental probablity of 20 dice rolls"/>
We can then write the logic for creating the histogram from the request. As seen in the above url, there are 4 query parameters that we want a user to be able to configure, the data, y-label, x-label, and title.
@main_api.get("/histogram")async def create_histogram(ctx: HttpContext) -> None# Extract the comma-delimited data and split it into arraydata = ctx.req.query.get("data")[0].split(',')# Get the optional histogram labelsxlabel = ctx.req.query.get("xlabel")ylabel = ctx.req.query.get("ylabel")title = ctx.req.query.get("title")try:data = [int(d) for d in data]data.sort()except ValueError:# If casting to int throws error, return a bad request status codectx.res.status = 400returnplt.hist(x=data)# The title, ylabel and xlabel are all optional so check they exist before using them.plt.title(title[0] if title is not None else "")plt.xlabel(xlabel[0] if xlabel is not None else "")plt.ylabel(ylabel[0] if ylabel is not None else "")
We will also want to make the bins for our histogram equal to the range of the histogram. For this we will use numpy, as it will support using floats as well as integers.
uv add numpy
import numpy as np...# Get the number of bins as the x-range of the dataplt.hist(x=data, bins=np.arange(min(data), max(data) + 2, 1))...
At this point the plot will be created, however, nothing but a 200 status will be returned to the user. To actually return the data as an image to the user, we will need to first get the image data.
import iowith io.BytesIO() as buffer: # use buffer memoryplt.savefig(buffer, format='png')buffer.seek(0)ctx.res.body = buffer.getvalue()ctx.res.headers = { 'Content-Type': 'image/png' }
This will convert the plot to a png and store it in the buffer. We can then return it in the body of our response and set the header to the correct content type. At the end we want to reset the plot. The plot not being cleared will only effect local reruns, as once deployed the state is ephemeral.
with io.BytesIO() as buffer: # use buffer memoryplt.savefig(buffer, format='png')buffer.seek(0)ctx.res.body = buffer.getvalue()ctx.res.headers = { 'Content-Type': 'image/png' }plt.close()
We can now test it in our browser. You can start the program by running:
nitric start
This will register our API and it's routes with the Nitric server ready for local testing. Open up a browser or HTTP client and use the URL:
http://localhost:4001/histogram?data=1,1,2,2,2,3,3,3,3,5,6,4,5,3,2,6,6,6,5,4&ylabel=Frequency&xlabel=Outcome&title=Outcome%20of%2020%20dice%20rolls
Browsing to this URL should produce a histogram like:
Deploy to the cloud
At this point, you can deploy what you've built to any of the supported cloud providers. In this example we'll deploy to AWS. Start by setting up your credentials and configuration for the nitric/aws provider.
Next, we'll need to create a stack file (deployment target). A stack is a deployed instance of an application. You might want separate stacks for each environment, such as stacks for dev, test, and prod. For now, let's start by creating a file for the dev stack.
The stack new command below will create a stack named dev that uses the aws provider.
nitric stack new dev aws
Edit the stack file nitric.dev.yaml and set your preferred AWS region, for example us-east-1.
provider: nitric/aws@latestregion: us-east-1
You are responsible for staying within the limits of the free tier or any costs associated with deployment.
Let's try deploying the stack with the up command:
nitric up
When the deployment is complete, go to the relevant cloud console and you'll be able to see and interact with your application.
To tear down your application from the cloud, use the down command:
nitric down
Have feedback on this page?
Open GitHub Issue