
If you’re new to Nitric, get a sense for how the open source framework works in this demonstration of local development, testing and deploying with Nitric. You can always dive into our docs or GitHub to learn more, or come chat with us in Discord to get answers to your questions.
Video Transcript
The Nitric framework helps developers build and deploy cloud applications extremely fast by automatically provisioning the resources required to run the application.
The framework also gives developers a local emulation of their application. Nitric will feel familiar to developers who have built applications with frameworks like KOA or Express. And in addition to providing an API service, it also provides developers with building blocks such as buckets for storage, queues, events for publishing and subscribing, scheduled tasks, and a key value store. Let's jump to a demonstration to show how you can get started.
Install the CLI and Create a Project
You can follow the instructions at nitric.io to install the CLI. Once you've got it installed, simply run the nitric new command to start a new project. I'm going to use the default project name. At this point you'll be prompted to select the language. Nitric supports any language and we're actively supporting TypeScript, Python and Dart with other languages to follow soon. In this example, I'm going to use TypeScript.
And navigate into our project. Now you can start your code editor. Let's quickly review the project structure. We have a services folder where you'd expect to see all of your application code. In the Nitric YAML, we actually define where our services folder is. So you have full flexibility here in case you want to structure your project as a monorepo.
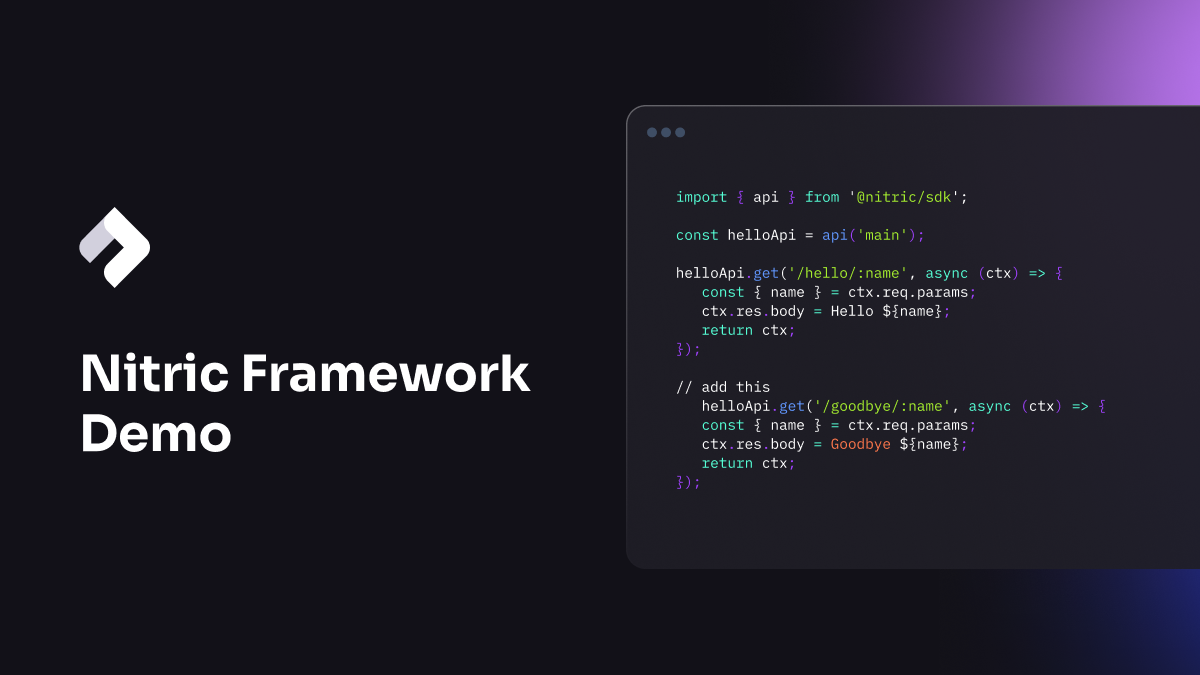
Otherwise, the project is a pretty straightforward TypeScript project, and you can include other frameworks or dependencies as required. In the default project, we just have a basic Hello World application, simply implementing an API with a get method that returns a hello response. Let's go ahead and resolve our dependencies.
Run and Test Locally
And at this point, once we're finished, we're ready to run our application. Because Nitric supports local emulation, all I have to do is run the nitric start command. I will be prompted with the Nitric dashboard, which allows us to interact with our API and test it locally. Let's give this a try. Here you see that we've got a Postman like experience where we're able to test our API out. When you're ready to test your application in the cloud, you'll need to create a new stack. So we'll head back to the CLI to do this.
Deploy to Your Cloud
To create a new stack run the command nitric stack new and give your stack a name. I'm going to target AWS, so I'll call my stack AWS Dev. And I'll choose AWS as my cloud provider. Now I need to edit the file that's being created for me, the YAML file, and give it a region. We're going to target the US East 2 region.
And if you look at the bottom of this file, there are other configuration settings that you can override if you like. We've already made best practice decisions on your behalf, but you can always update these at any time. Once you've finished editing this file, you're ready to run the up command.
During the up command, you'll see a tree gap of the relationship between your API and the cloud resources that you're using. We're also taking care to deploy your IAM roles and policies for you. This will take a few minutes, and once complete, you'll be given an endpoint to begin testing your API in the cloud.
Explore Architecture Visualizations
Let's jump to a project with more resources defined to further explore the visualizations in the dashboard. Here we have a simple project which is a bookstore application leveraging the following resources, an API and a KV store. In our implementation I've also taken care of handling the post method to create our books. The remainder of the API has placeholders for our get and our delete methods. We also have a scheduled service to handle reporting on a daily basis.
Our project is already ready to test out. So let's run the nitric start command. The dashboard will automatically update each time the developer makes a change to their code, allowing them to rapidly iterate and test their application. Developers can immediately trigger their API methods or their scheduled jobs by clicking the send or the trigger command. Let's go ahead and try the trigger command.
Nitric also automatically generates visualizations of the resources required by your project. You can see this in the architectural tab. Teams gain an immediate understanding of the project's run time, and this visualization also updates in real time.
Add Topics to the Project Let's update our code to handle some events. Let's say for whenever a book is added or removed, we want to inform other services in the system. To do this, we'll publish events to some topics. So we'll flick back over to our resources TS file and import 'topic' from the Nitric SDK, and create some topics. My first topic will be the book created topic, and I'll just copy this to make our book deleted.
We've separated our resources from our API for clarity, so we'll need to import our newly created resources into our API. And our deleted topic. As you can see on line 4, when we initialized our KV store, we set it up with an intention. We're allowing getting and setting on our KV store. We'll have to do the same thing for our topic, but in this case it'll be publishing. And we'll have to do the same with our deletion handler.
Now we can go ahead and use our events. I'll update our created books to include a publishing of the topic. In this case I only want to send through the title.
Real-Time Visualizations for Collaboration
Now if we flip back over to our dashboard, We'll see our updated resources and their association with the service itself. Without digging into the code, immediately an architect or another team member can walk by and see what's been implemented. They are also able to make suggestions of optimization and improving collaboration.
For example, in this case, maybe we don't want two topics published whenever a book is updated. These could potentially be consolidated into a single event called book updated, with a state variable inside of it letting us know what type of update it was. This could minimize costs and doesn't require waiting until the project is completed or fully fleshed out to make these sorts of optimizations.
Spot Rogue Resources
Real time visualizations also give teams the ability to spot rogue resources. For example, if we head back to our code and we comment out code that's involved with our storage bucket. We'll notice that the lines connecting our storage bucket to our service have been disconnected. And this allows us to quickly notice or spot anomalies in our code and mediate them. Again, if I uncomment the code, we should see these connections restored and a more clear picture of what's happening with our resources.
Visualizations are extremely useful for keeping teams in sync and sharing information with stakeholders who aren't already able to dive into the code. We're excited to see how this feature helps to bridge communication within your team.
Head to our docs to get started and connect with us on Discord if you need any help or have suggestions for feature improvement.
Checkout the latest posts
Build Azure Infrastructure Using AI and Terraform
Learn how to leverage AI and Terraform to build and deploy Azure infrastructure directly from your application code with Nitric.

GenAI Made Terraform More Relevant Than Ever
Infrastructure as Code is more alive than ever, but it is no longer something teams should write line by line.
The Deployment Bottleneck No One Talks About
The real bottleneck might not be in your pipeline but rather in how your application interacts with cloud services.
Get the most out of Nitric
Ship your first app faster with Next-gen infrastructure automation