
Welcome back, developers! In today's blog post, we'll be diving into the exciting topic of debugging made easy with the Nitric Start command. Whether you're into cloud development, local debugging, or simply want to enhance your developer experience, Nitric has got you covered. So grab your favorite debugging hat and let's get started!
If you prefer a video format, you can watch the full tutorial on YouTube.
Create a new project
To begin, make sure you have the Nitric CLI installed on your machine. Once that's done, open up your terminal window and let's create a new project using the nitric new command.
nitric new
Choose a template
After executing the command, you'll be prompted to enter a name for your project. In this tutorial, we'll refer to our project as my-nitric-app. Nitric offers different templates, and in this case, we'll choose TypeScript as our favorite language.
? What is the name of the project? my-nitric-app? Choose a template: [Use arrows to move, type to filter]> official/TypeScript - Starterofficial/JavaScript - Starterofficial/Python - Starterofficial/C# - Starter (experimental)
After downloading the template, open the project directory in your preferred code editor, such as VS Code.
# Will open the directory in VS Codecode my-nitric-app
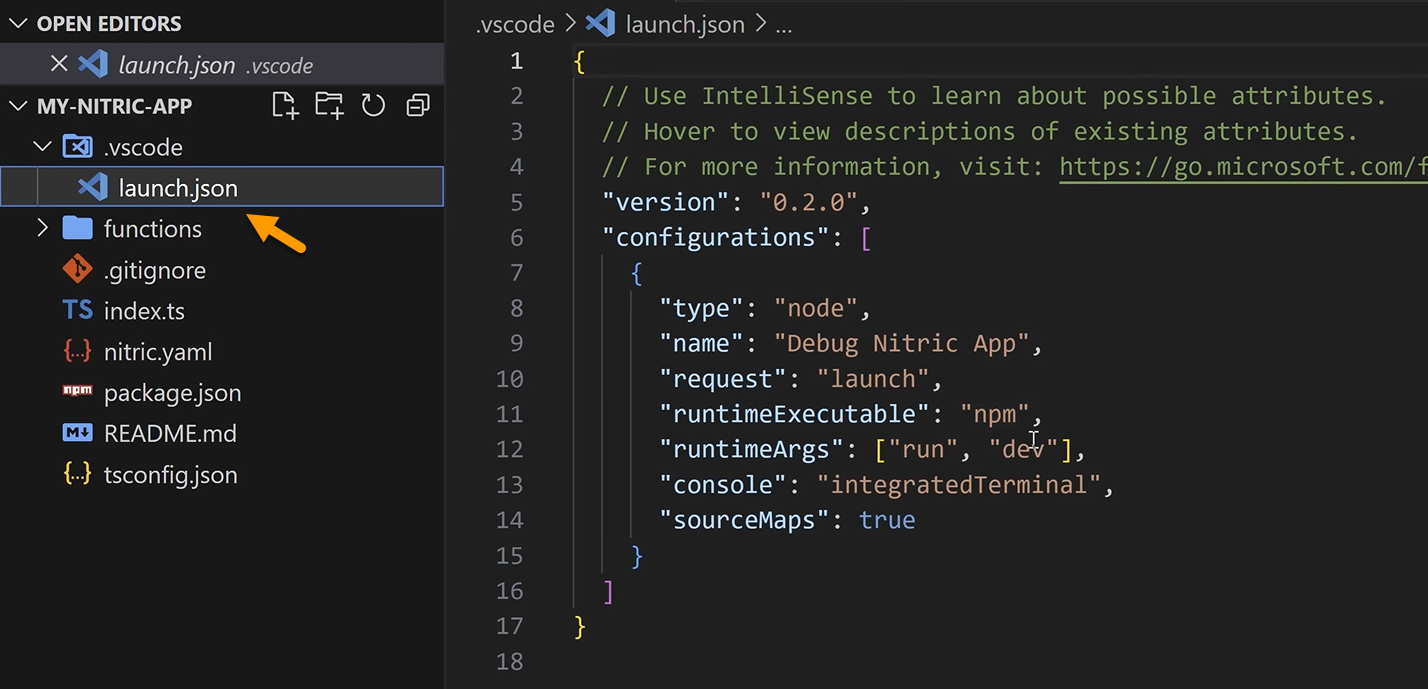
Nitric provides ready-to-use VS Code launch files for debugging in both TypeScript and JavaScript templates. These launch files bring consistency, collaboration, simplified onboarding, and version control to your debugging process. They ensure that everyone on the project can quickly and efficiently set up and debug the local cloud environment in a standardized way.
Every Nitric template includes a convenient dev script that seamlessly runs both nitric start and your application locally. In the TypeScript and JavaScript templates, the script is defined in the package.json file.
Install dependencies
Let's install the projects dependencies using your preferred package manager:
# for yarn usersyarn install# for npm usersnpm install
Inspect the code
Now that we have the project set up, let's take a look at the code. We have a hello.ts file that contains a main API with a GET route for /hello/{name}. This route takes a name path parameter and simply sends it back within a string in the response body.
import { api } from '@nitric/sdk'// main APIconst helloApi = api('main')// GET route for /hello/{name}helloApi.get('/hello/:name', async (ctx) => {const { name } = ctx.req.paramsctx.res.body = `Hello ${name}`return ctx})
Start debugging
It's time to fire up and run our application. Head over to the run and debug tab in VS Code and click the "Start Debugging" button. In the terminal, you'll see some helpful information from the Nitric CLI, including the API endpoint and the dev dashboard URL.
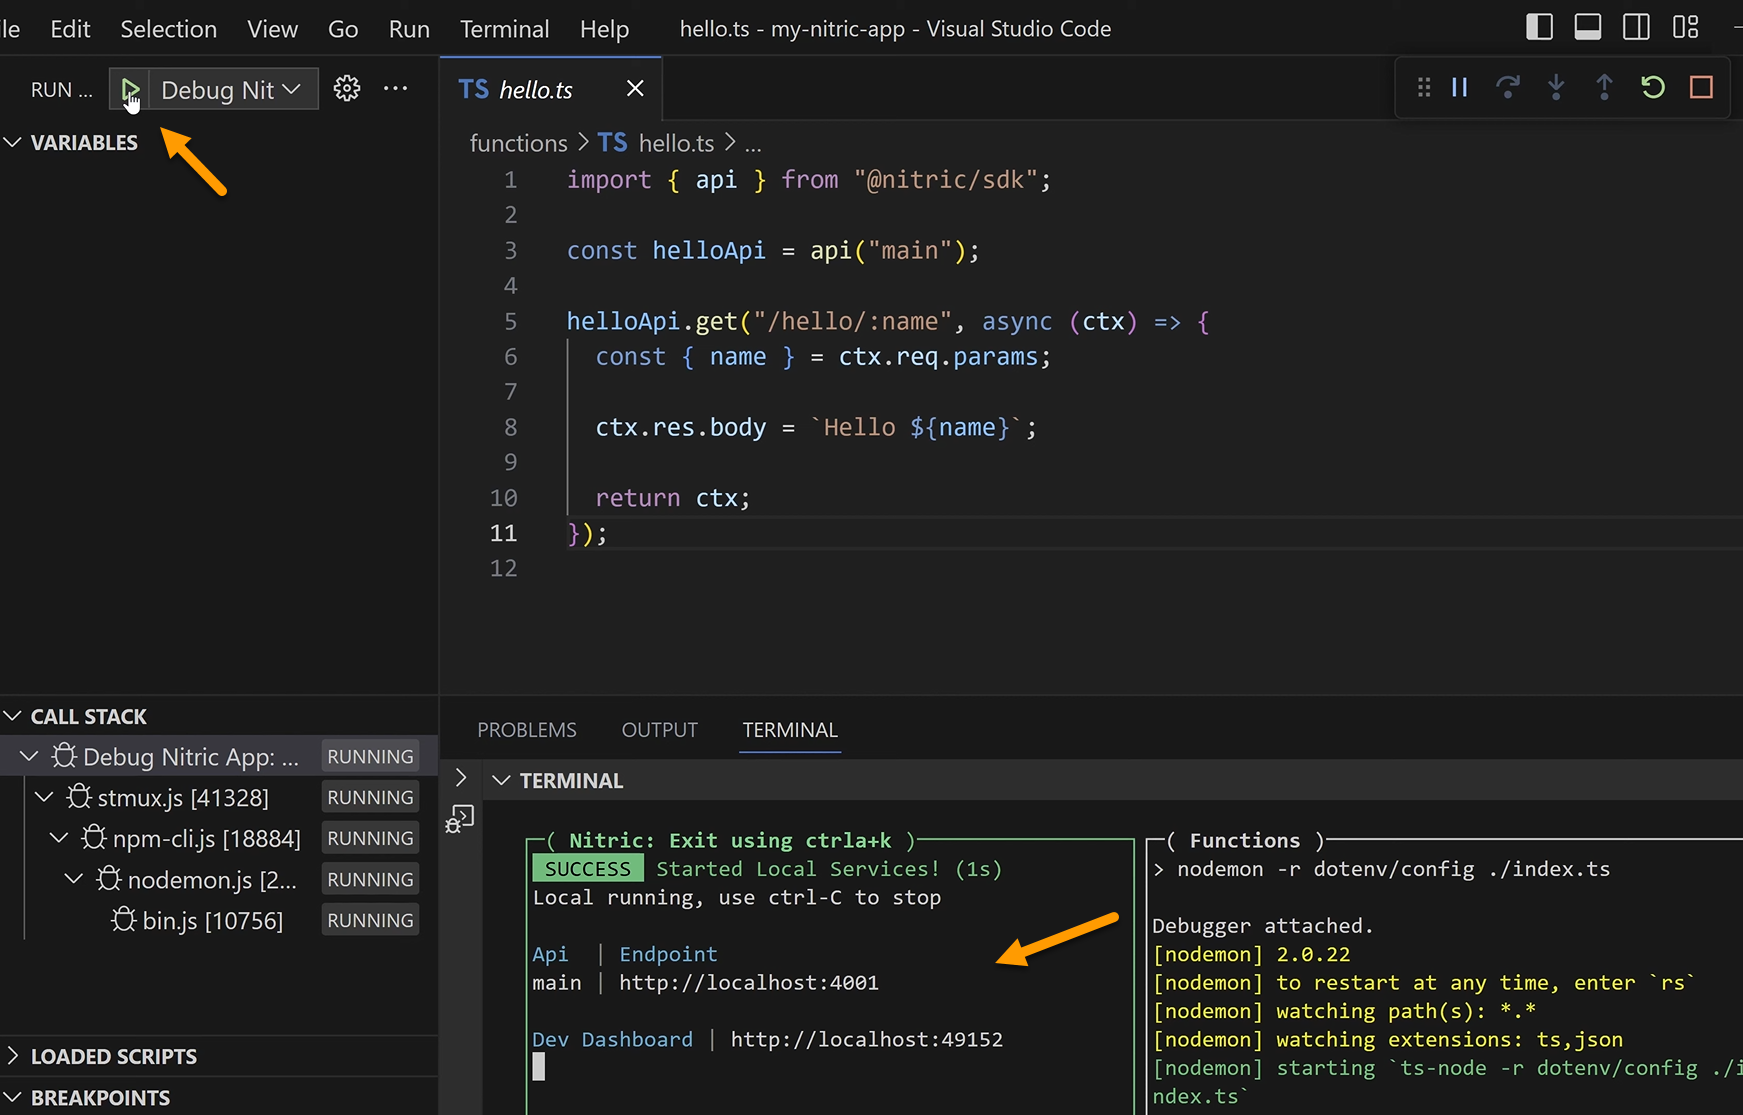
To set a breakpoint, we'll choose a line where we want to pause the execution. For example, let's put a breakpoint on line 8. Next, open up the Nitric local dashboard at http://localhost:49152, which provides a user-friendly interface for managing your local environment. Read more about the Local Dashboard in our docs.
Local Dashboard
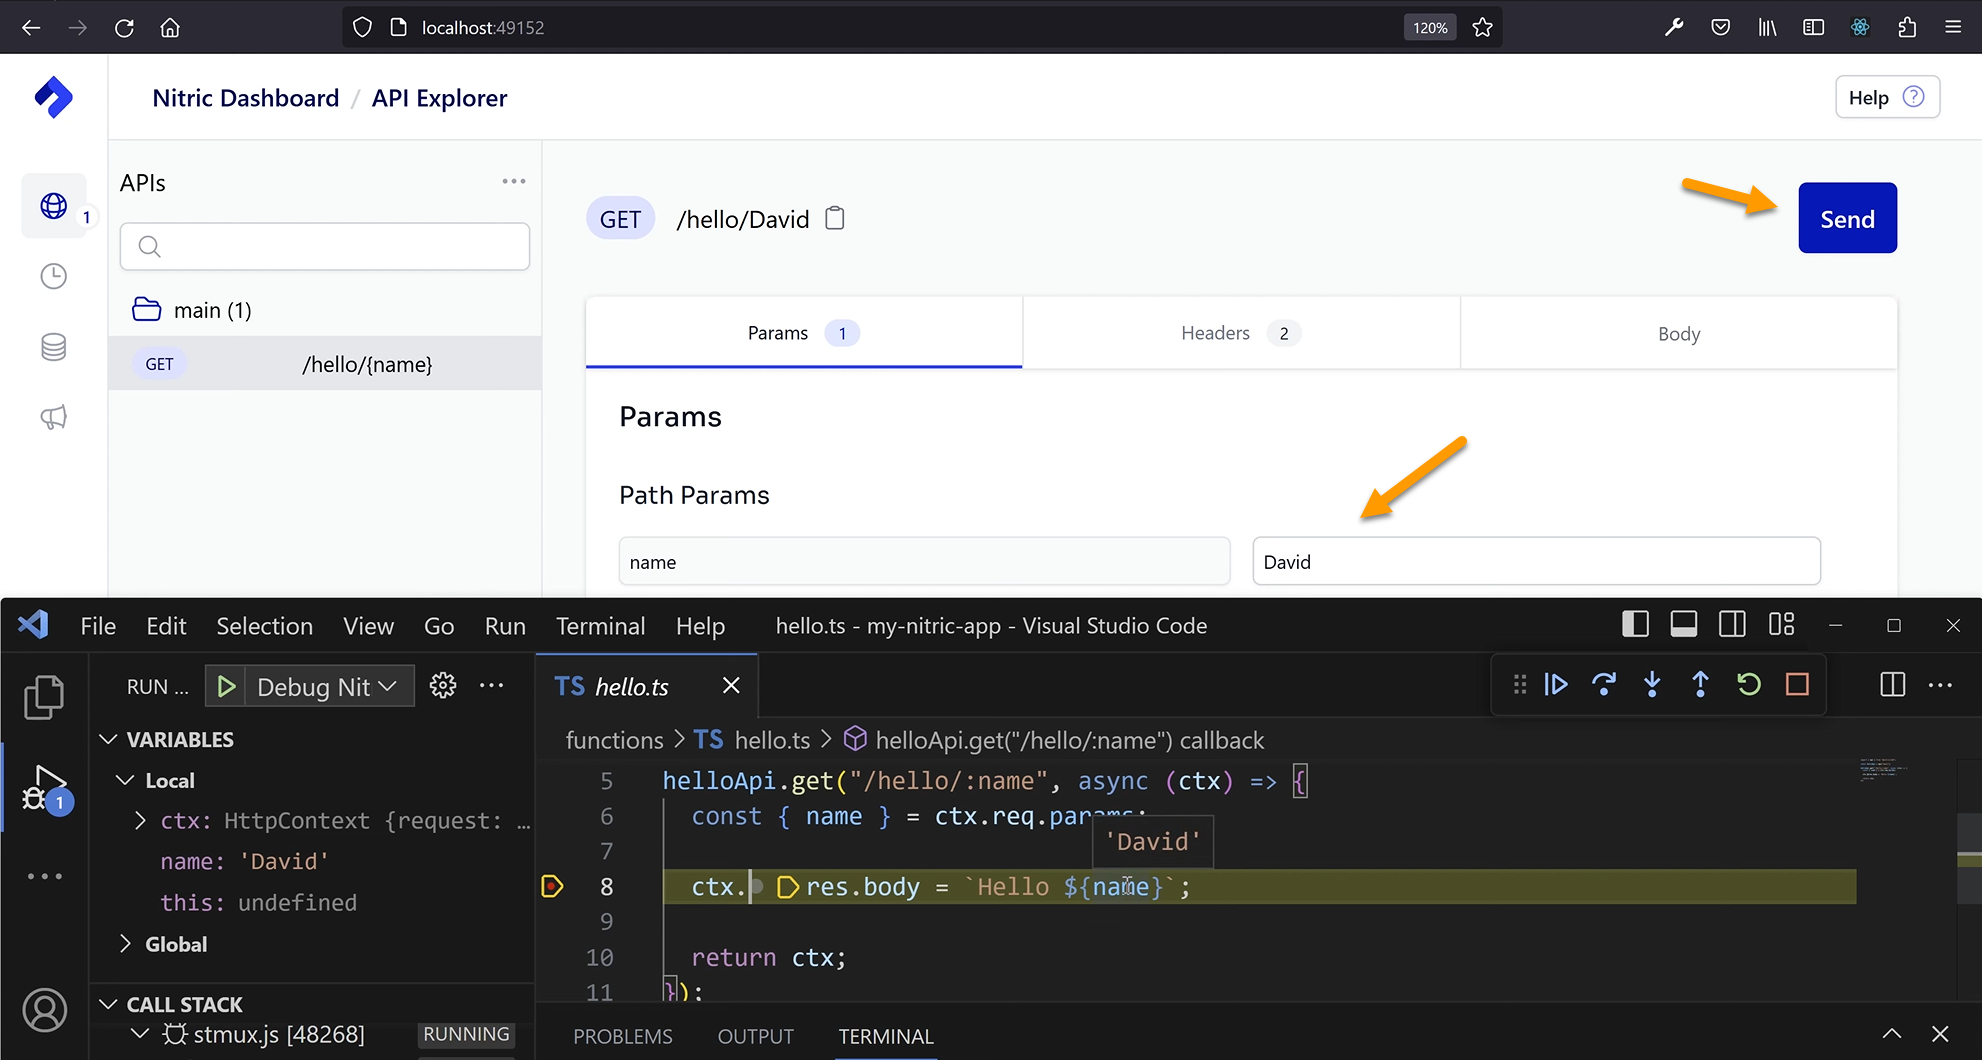
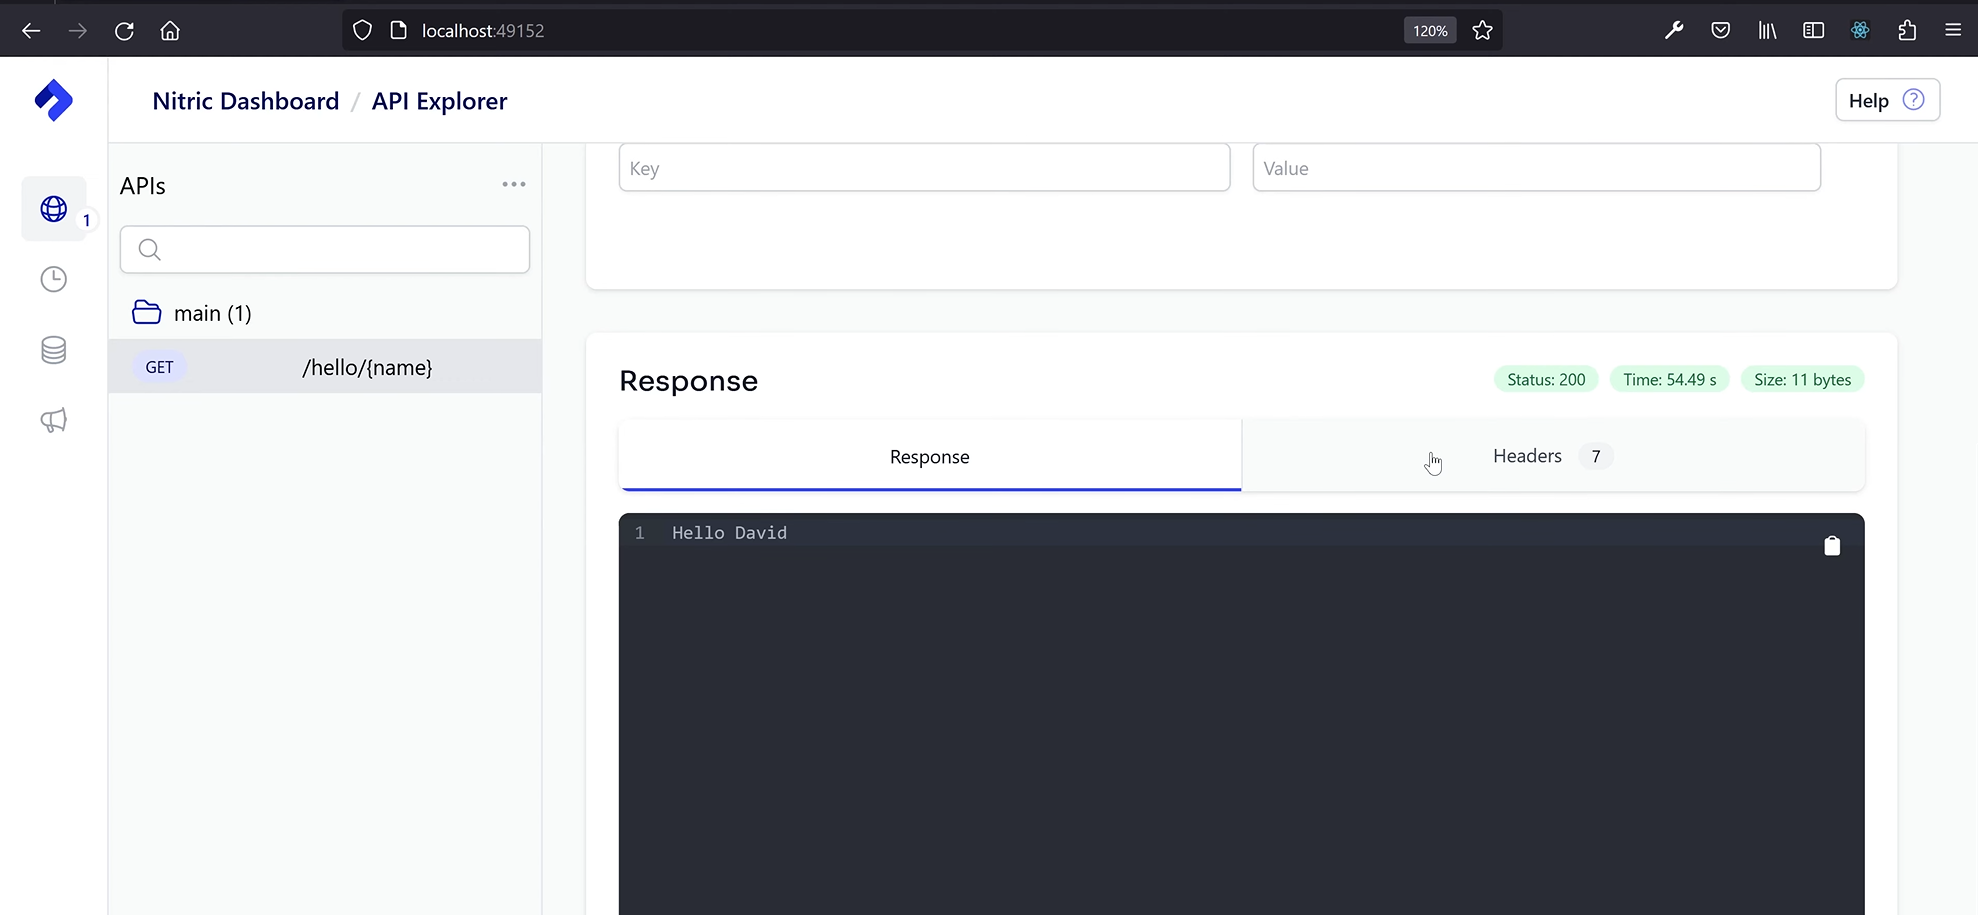
In the Nitric dashboard, navigate to the API Explorer page. On the left, you'll find an API tree with the main API folder and the GET request route for /hello/{name}. On the right-hand side, you can see the path parameters and query parameters for the selected route.
To hit our breakpoint, let's try sending a request. However, before we do that, we need to fill in the required name path parameter. Once filled, click "Send." The breakpoint will be hit, and you can go back to VS Code and hover over the name parameter to verify that it's coming through correctly.
Additionally, you can explore the response body and headers in the local dashboard.
Traceability
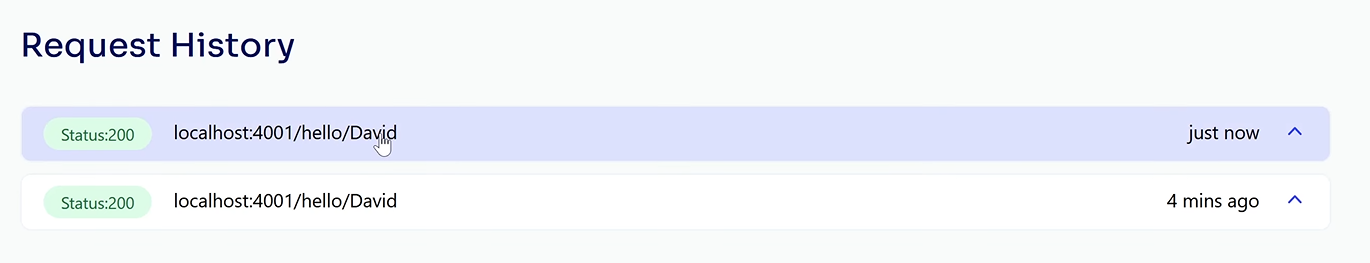
The Nitric local dashboard provides full traceability, allowing you to track and log requests and responses. It helps you identify issues, troubleshoot problems, and ensure your APIs are working as expected. You can inspect HTTP headers, request history, and response bodies to gain insights into your application's behavior.
Add more features
Now that we've seen the debugging process in action, let's add a couple more features to our application and test out the debugging on those as well. We'll add a scheduled task called "Weekly Cleanup" and a storage bucket with bucket notifications.
import { api, bucket, schedule } from '@nitric/sdk'// main APIconst helloApi = api('main')const myBucket = bucket('my-bucket')// bucket notification that runs on any file uploadedmyBucket.on('write', '*', (ctx) => {console.log(ctx)})// schedule that runs every 7 daysschedule('weekly cleanup').every('7 days', (ctx) => {return ctx})// GET route for /hello/{name}helloApi.get('/hello/:name', async (ctx) => {const { name } = ctx.req.paramsctx.res.body = `Hello ${name}`return ctx})
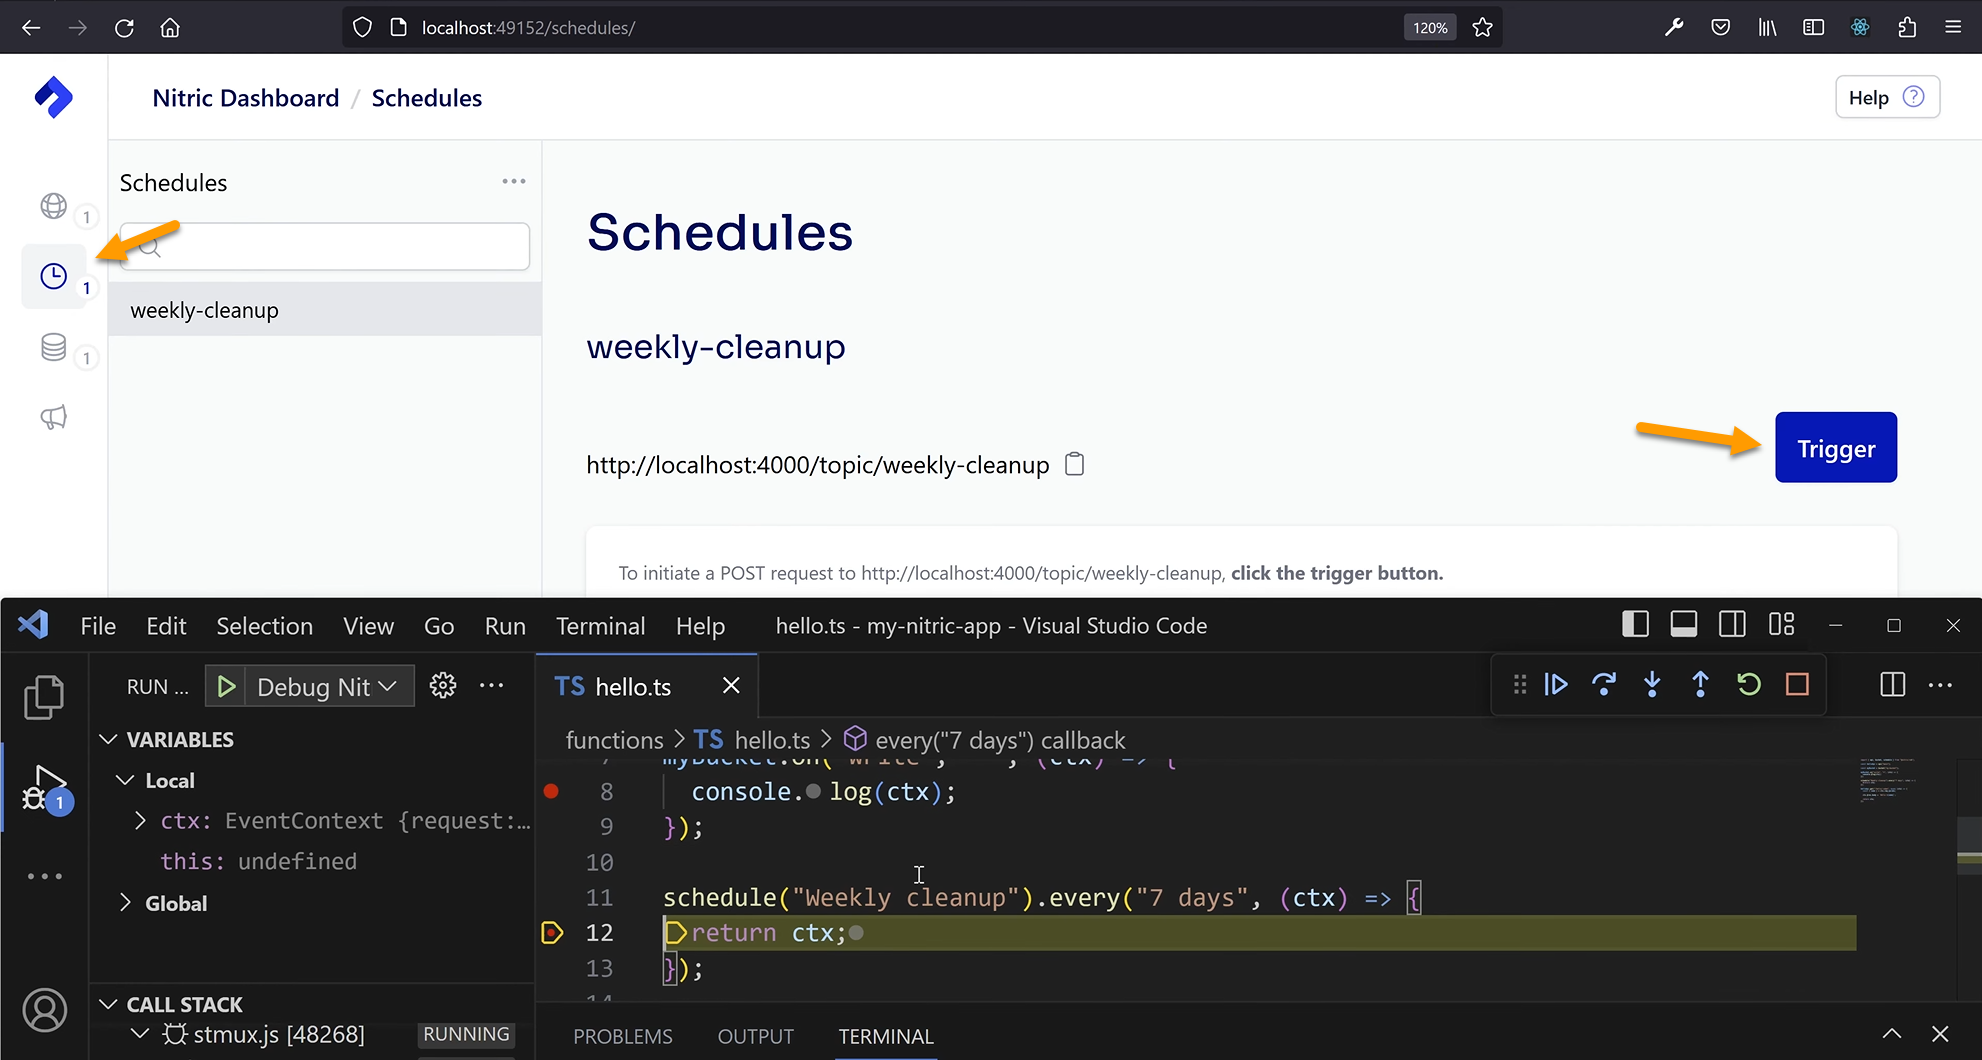
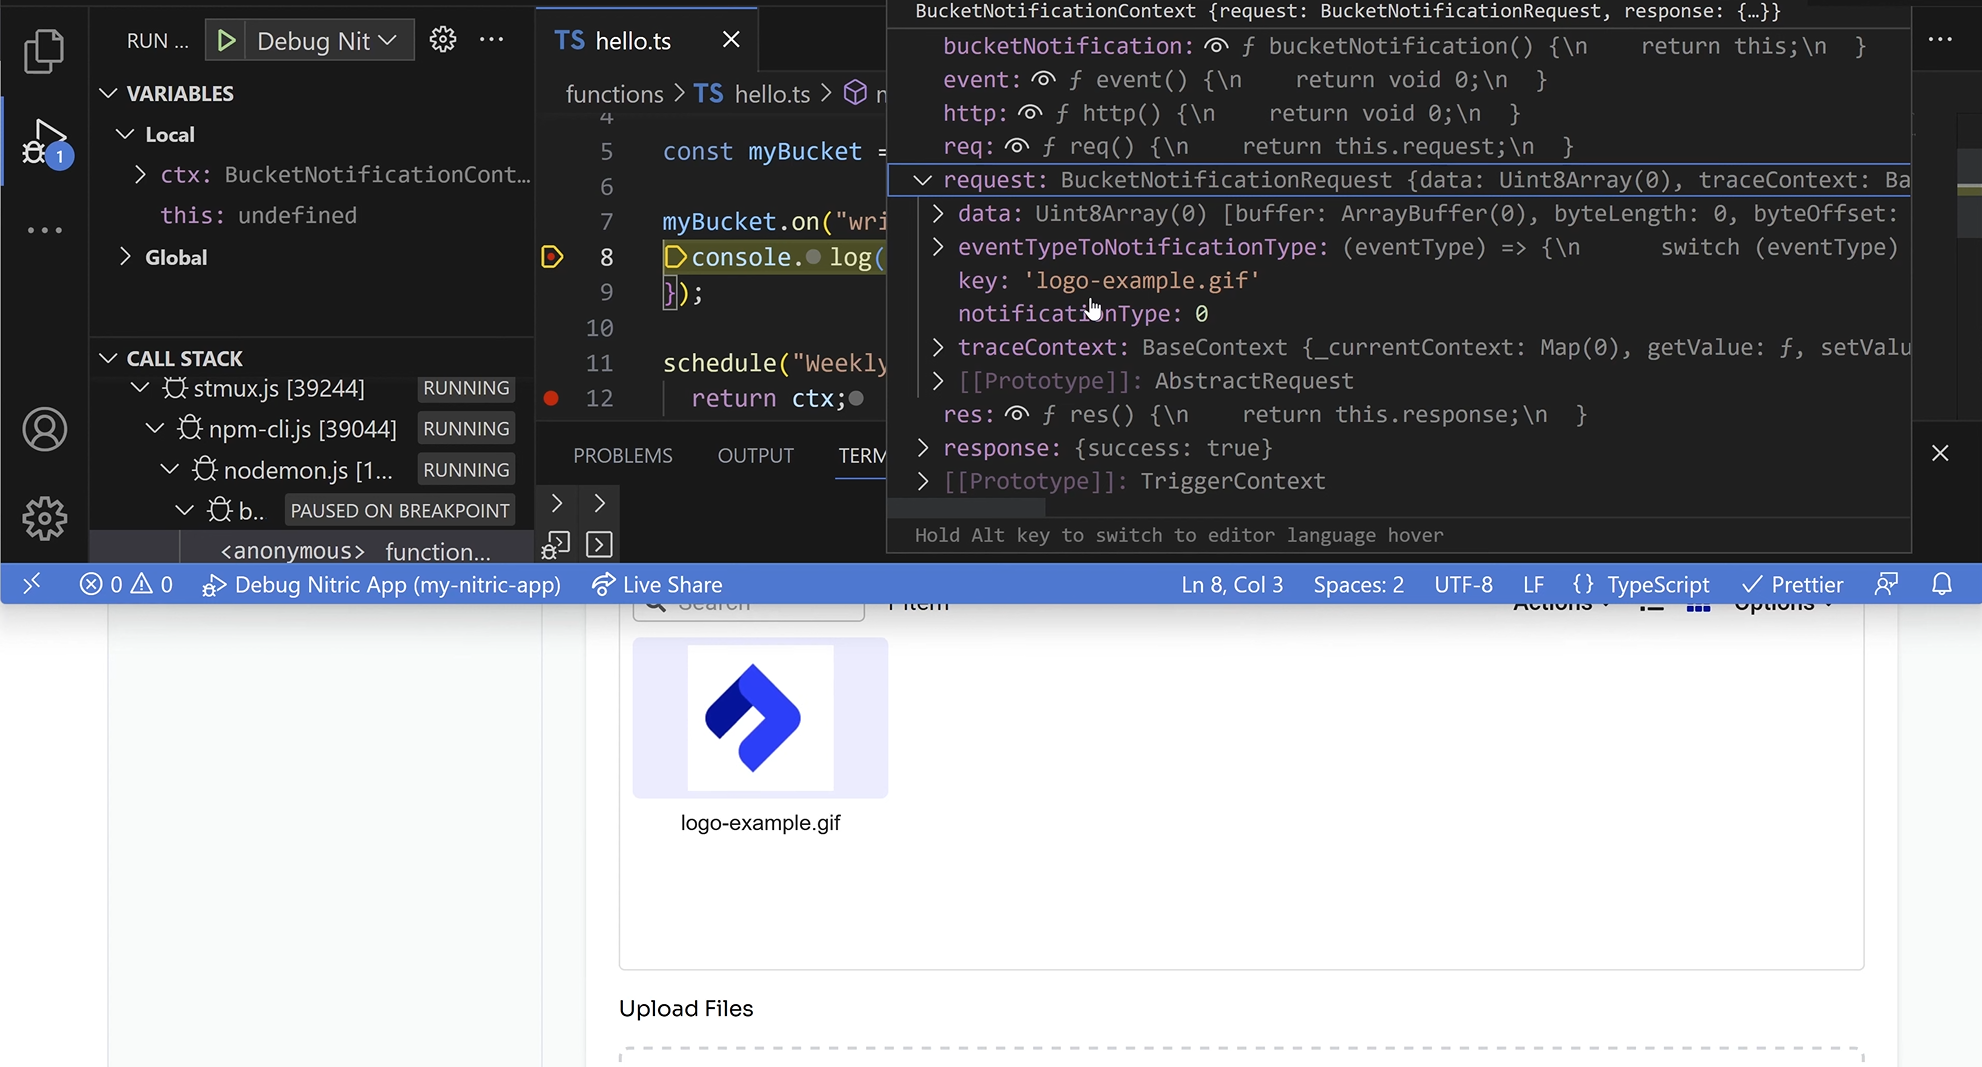
Once we save the changes and refresh the dashboard, we can see the updated schedules and storage configurations. By triggering the scheduled task or uploading a file to the bucket, we can observe the breakpoints being hit and inspect the associated request details.
Triggering the scheduled task.
Triggering the bucket notification after uploading a file to the bucket.
Conclusion
Nitric empowers developers by streamlining the debugging process and supercharging the overall developer experience. Whether you're a cloud engineer, seasoned developer, or simply curious about the magic behind the scenes, Nitric provides the tools to make debugging easy and efficient.
We hope you found this crash course on debugging with the Nitric Start command enjoyable and helpful! To dive deeper into Nitric and explore more guides and content, make sure to check out our getting started section in the documentation and come chat with us in Discord. Happy exploring!
Happy coding and happy debugging!
Checkout the latest posts
Build Azure Infrastructure Using AI and Terraform
Learn how to leverage AI and Terraform to build and deploy Azure infrastructure directly from your application code with Nitric.
GenAI Made Terraform More Relevant Than Ever
Infrastructure as Code is more alive than ever, but it is no longer something teams should write line by line.

The Deployment Bottleneck No One Talks About
The real bottleneck might not be in your pipeline but rather in how your application interacts with cloud services.
Get the most out of Nitric
Ship your first app faster with Next-gen infrastructure automation